How strong is a power line's magnetic field at 50, 100 and 300 feet?
For typical high-voltage transmission lines, the average magnetic field at the edge of the right-of-way runs from about 6.5 milligauss for a 115 kV line to 29.4 mG for a 500 kV line. Those are Bonneville Power Administration figures reprinted by NIEHS. At 300 feet the averages drop to between 0.2 and 1.4 mG, close to what many homes measure from their own wiring. During peak load, about 1% of the time, the fields run roughly twice as high.
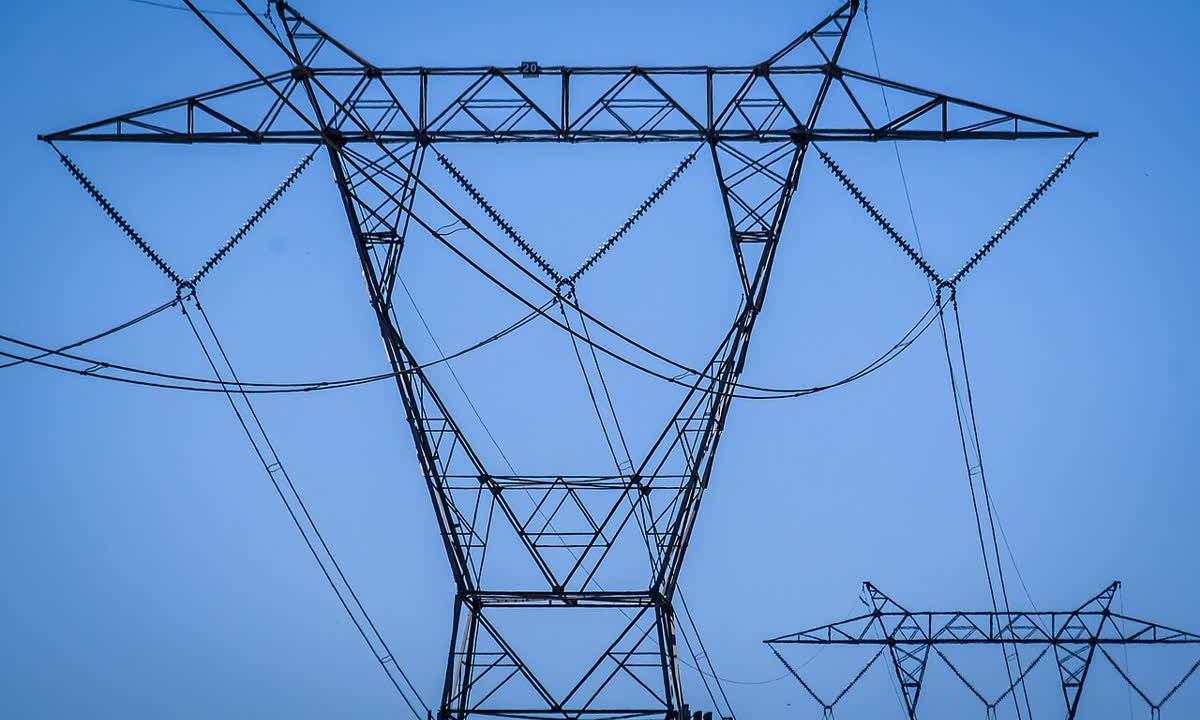
The NIEHS figures, line by line
NIEHS printed these figures on page 37 of its June 2002 booklet, EMF: Electric and Magnetic Fields Associated with the Use of Electric Power. The values are means for 321 lines in the Pacific Northwest at 1990 annual average loads, taken 1 meter (3.3 feet) above the ground. The booklet calls them general information and says to contact the operating utility for numbers on a specific line.
Mean field in milligauss, 1 m above ground, 1990 annual mean loads. The right-of-way (ROW) edge is 50 ft from the line for 115 and 230 kV and 65 ft for 500 kV.
Show the numbers
| Distance | 500 kV | 230 kV | 115 kV |
|---|---|---|---|
| At the line | 86.7 | 57.5 | 29.7 |
| ROW edge | 29.4 | 19.5 | 6.5 |
| 100 ft | 12.6 | 7.1 | 1.7 |
| 200 ft | 3.2 | 1.8 | 0.4 |
| 300 ft | 1.4 | 0.8 | 0.2 |
Source: NIEHS 2002 booklet, page 37, Bonneville Power Administration data, 1994.
The NIEHS EMF page, last reviewed in June 2026, still uses the middle row as its example. It gives 57.5 mG right beside a 230 kV line, 7.1 mG at 100 feet and 1.8 mG at 200 feet.
Average load versus peak load
The 2002 booklet lists averages only, with a note that peak loads, about 1% of the time, bring fields about twice as strong. WHO's Environmental Health Criteria 238 reprints a 1995 NIEHS version of the table with both rows. We converted its microtesla values to milligauss by multiplying by 10.
| Line | Load | At the line | 15 m (50 ft) | 30 m (100 ft) | 61 m (200 ft) | 91 m (300 ft) |
|---|---|---|---|---|---|---|
| 115 kV | Average | 30 mG | 7 mG | 2 mG | 0.4 mG | 0.2 mG |
| 115 kV | Peak | 63 mG | 14 mG | 4 mG | 0.9 mG | 0.4 mG |
| 230 kV | Average | 58 mG | 20 mG | 7 mG | 1.8 mG | 0.8 mG |
| 230 kV | Peak | 118 mG | 40 mG | 15 mG | 3.6 mG | 1.6 mG |
| 500 kV | Average | 87 mG | 29 mG | 13 mG | 3.2 mG | 1.4 mG |
| 500 kV | Peak | 183 mG | 62 mG | 27 mG | 6.7 mG | 3.0 mG |
"At the line" is the maximum on the right-of-way. The WHO table heads the second column 15 m for every voltage, while the 2002 NIEHS booklet puts the 500 kV right-of-way edge at 20 m (65 ft). Peak divided by average comes out between 2.0 and 2.25 in every column, which matches the booklet's "about twice."
Why the field falls off so fast
Look at the 230 kV row as you move from 100 to 200 feet. The average drops from 7.1 to 1.8 mG, a factor of 3.9. Going from 200 to 300 feet it drops from 1.8 to 0.8 mG, a factor of 2.25. A field that falls with the square of distance would shrink by exactly 4 and exactly 2.25 over those two steps. The 500 kV row behaves the same way (3.9 and 2.3).
WHO's review explains that fields from different sources fall with distance at different rates: as 1/r, 1/r² or 1/r³. A double-circuit line can be strung with its two circuits in reversed phase order so their fields partly cancel, and then the field falls closer to 1/r³. The same review describes UK National Grid figures averaged over 43 lines and a year of load data:
| Distance from a UK National Grid line | Average field |
|---|---|
| 0 m | 4.005 µT (about 40 mG) |
| 50 m | 0.520 µT (about 5.2 mG) |
| 100 m | 0.136 µT (about 1.4 mG) |
| 200 m | 0.034 µT (about 0.34 mG) |
| 300 m | 0.015 µT (about 0.15 mG) |
From 100 to 200 meters the UK average falls by a factor of 4.0, the same inverse-square pattern seen in the US figures.
Load matters more than voltage
The EPA's page on power line fields puts it simply: field strength is proportional to the current in the line. Voltage still matters indirectly. WHO notes that higher-voltage lines usually carry more current and have wider conductor spacing, so they usually produce stronger magnetic fields, "even though the magnetic field itself does not depend on the voltage." Current also changes the conductor temperature, which changes sag and the height of the wires above the ground.
The NIEHS booklet shows what this looks like on one 500 kV line, measured on its right-of-way every five minutes for a week. The field never went below 22.4 mG or above 62.7 mG, and the weekly mean was 38.6 mG. The highest reading was 2.8 times the lowest. Electric fields from the same line stay fairly steady because line voltage hardly changes. WHO adds that lines usually run well below their rated load, so typical fields sit well below what a line could produce at full capacity.
Distribution lines, buried cables and substations
Distribution lines carry power from the substation to homes, and WHO notes they are more often strung on wood poles. In North America they usually run at 4 to 24 kV, according to NIEHS. Directly beneath them the field is typically 10 to 20 mG for main feeders and under 10 mG for the smaller laterals, with peaks measured as high as 70 mG. Above underground distribution lines the typical range is similar, with peaks up to 40 mG.
Burying a line removes the electric field above ground but not the magnetic field. WHO's review says buried cables usually give lower fields off to the side than an equivalent overhead line, but the field can be higher directly over the cable route, since the conductors may sit only about 1 meter underground instead of 10 meters overhead.
Substations matter less than their size suggests. NIEHS says the strongest field outside a substation usually comes from the lines running in and out, and that beyond the fence the equipment's field is typically indistinguishable from background. UK figures in the WHO review put typical values at the fence at 10 µT (100 mG) for 275 and 400 kV substations and 1.6 µT (16 mG) for an 11 kV one. In one survey the field at the boundary halved within an average of 1.4 meters.
How these numbers compare with the limits
The 2002 NIEHS booklet listed two states with magnetic field limits at the edge of a transmission right-of-way. Florida set 150 mG for 69 to 230 kV lines and 200 mG for 500 kV lines, and New York set 200 mG, both at maximum load. NIEHS noted that state limits were usually set at what existing lines already produced at maximum load. The peak 500 kV figure at the right-of-way edge in the table above, 62 mG, is about 31% of a 200 mG limit. The international ICNIRP reference level for the public, 2,000 mG, is far above every number on this page. State rules can change, so check the current version with your state utility commission.
Getting numbers for one particular line
- Find out who operates the line and at what voltage. NIEHS points readers to the operating utility for figures on a specific line.
- Measure the distance from the line itself to where people spend hours, such as a bedroom. The tables are measured from the line, not from a property boundary.
- Ask for a measurement. PG&E offers free EMF measurements to customers with concerns, at 1-877-660-6789, and SDG&E takes requests through a web form and replies within three business days. SDG&E says it won't interpret the results.
- Repeat readings at different times of day and in different seasons. The one-week 500 kV record above swung by a factor of 2.8.
- Compare the result with home background. In the 992 homes EPRI measured, half had a room-by-room average of 0.6 mG or less.
Some people stop once they have a number. Others move a bed to the far side of the house or weigh a line's distance before buying. Some buy consumer products, for example from the EMFCALM shop, which sells sticker packs for a whole household of phones, tablets and routers. Those are wireless devices that work at radio frequencies, a different subject from a 60 Hz line, and we don't evaluate such products.
At 300 feet, even the 500 kV line in the NIEHS table averages 1.4 mG. A whole-house average that high would put a home in the top quarter of the EPRI sample, though not the top 15%. That comparison is rough, since one is measured outdoors and the other indoors, but it explains why the wiring in your own walls can matter about as much as the line across the road once you are a few hundred feet away.